What the polls say, and what they don't
I’ve now read just about every publicly available poll with cross tabs that’s come out since “The Debate” in an attempt to understand if anyone could make a data-driven decision about whether Biden should stay in the race.
First though, “Do you think polling data is as accurate as it used to be?”
Biden made this argument — in essence, that polls aren’t accurate — in his interview with George Stephanopoulos on Friday.
Let’s briefly talk about what he (most likely) meant by that by just reviewing the last few general election cycles.
There is still a pervasive sense that the polls were wrong in 2016, yet the national vote polling averages were remarkably accurate; indeed Clinton did win the popular vote. But that wasn’t enough to carry off the Electoral College, and on this form of modeling, the forecasts based on polls can be said to have been inaccurate.
In 2020, according to AAPOR:
“Most national polls accurately estimated that President Joe Biden would get more votes than President Donald Trump nationally, but Biden’s certified margin of victory fell short of the average margin in the polls at both the national and state levels. Polling overstated support for Biden relative to Trump, and Biden’s 306-232 victory in the Electoral College was narrower than predicted by many election forecasters.”
They further elaborated that:
“The 2020 polls featured polling error of an unusual magnitude: It was the highest in 40 years for the national popular vote and the highest in at least 20 years for state-level estimates of the vote in presidential, senatorial, and gubernatorial contests.”
AAPOR reported that the error always ran in Biden’s favor, remained stable throughout the campaign, and can’t be explained by the things we thought undercounted Trump’s support in 2016 (e.g., weighting by education, incorrect assumptions about the demographic makeup of the actual electorate, the “shy Trump” effect, or issues related to late-deciding voters or early/Election Day voting).
In fact, AAPOR can’t say with certainty why these polling errors occurred. Some possible culprits may, frankly, be quite hard to overcome: non-response bias, and difficulty comparing poll response to actual voting behavior chief among them. Both make it hard to say with certainty that those inside the sample frames represent the overall electorate, or whether what people say in response to a survey is identical to what they do with their ballots. Even if the error this introduces is “only” <5% of the total sample, this is a lot of error, especially in such closely run elections.
Now, in 2022, according to FiveThirtyEight, the polls were the most accurate they had been since at least 1998. So perhaps polls are just uniquely bad at modeling the presidential election, or even just at modeling elections where Donald Trump is one of the candidates.
Here’s my feeling about polls, as a researcher. Any poll is, of course, a snapshot in time. It may be perfect, it may be wrong, it may be wide of the mark, it may be close to the truth. But like the saying “all models are wrong, but some are useful”, there are hints in the data at a micro and macro level.
Still, any series of polls conducted consistently over time will give you an image of a possible trend. The trend gives you a sense of direction and when it comes to the direction of this election, we can look at the polling averages:
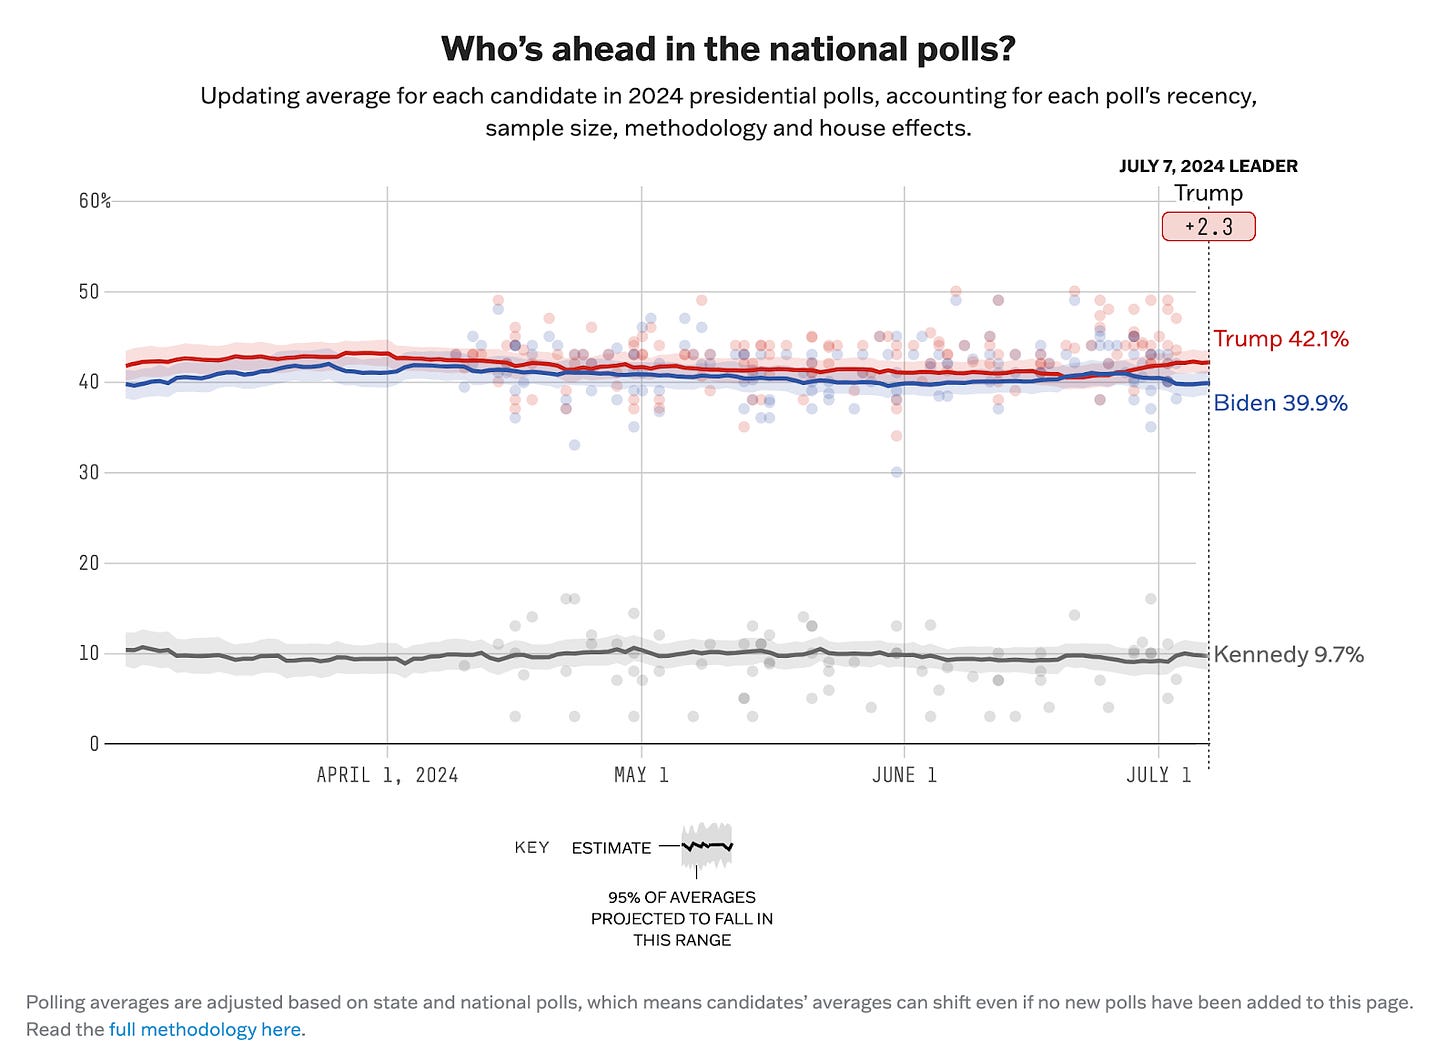
The direction is a straight line.
The race is tied. Even “The Debate” hasn’t shifted the averages much. I can’t tell you how weird that is. We talk about our polarized electorate, and how consistently close the last few elections have been, but the 2024 trendline just looks different.
Compare it to 2020.
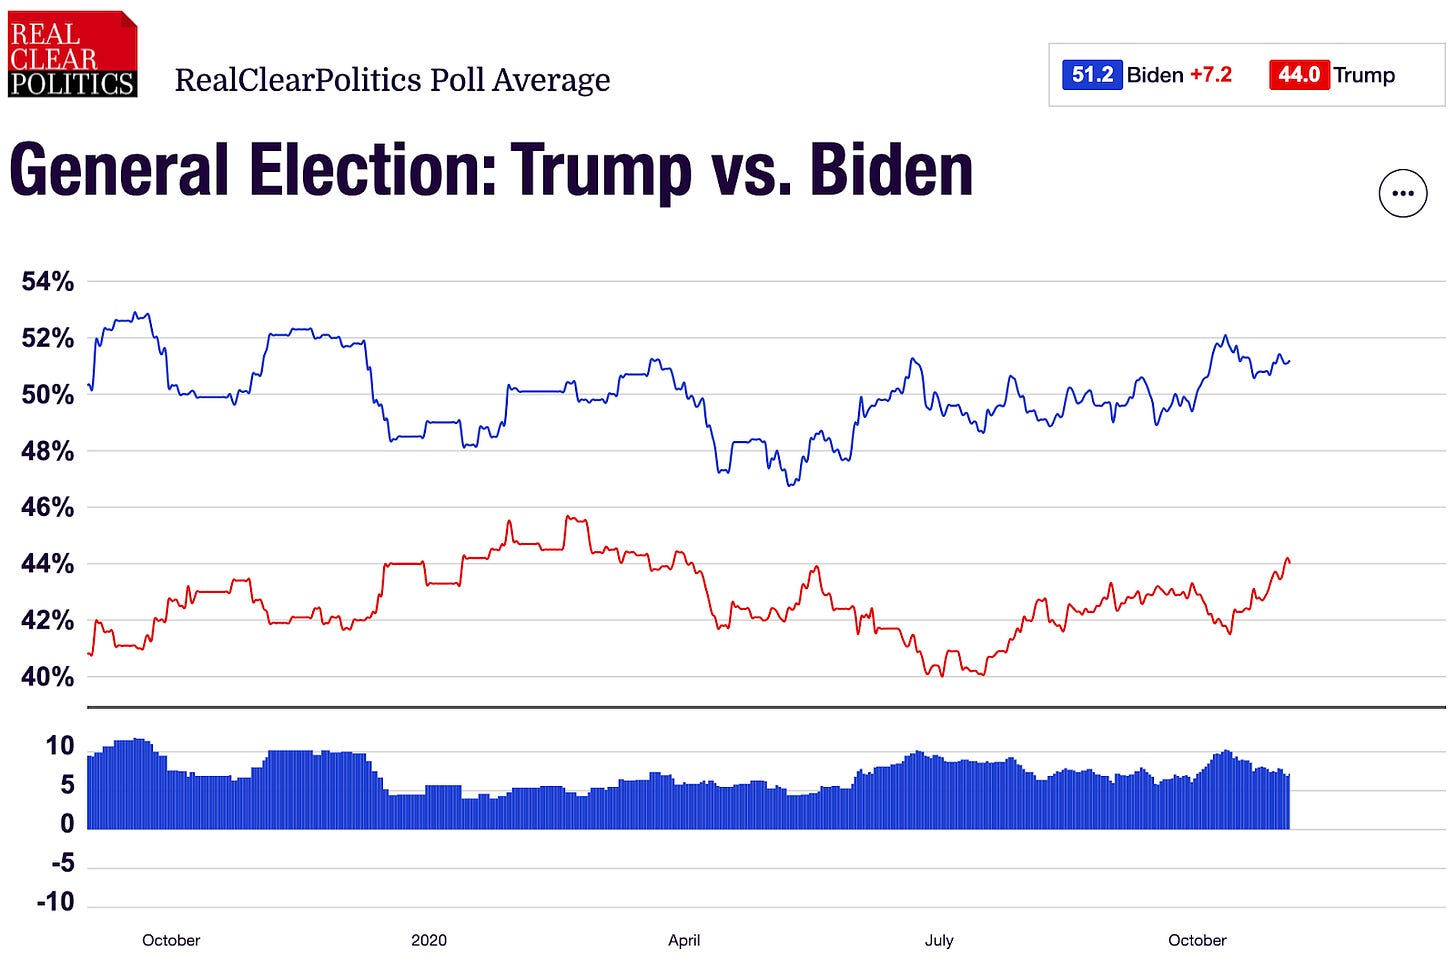
There was a lot more movement in 2020, even if the general trend showed Biden winning at every point in the campaign. The gap was so great that even if the actual vote totals narrowed the race, it was still likely Biden would win.
Let’s look at some historical polling averages:
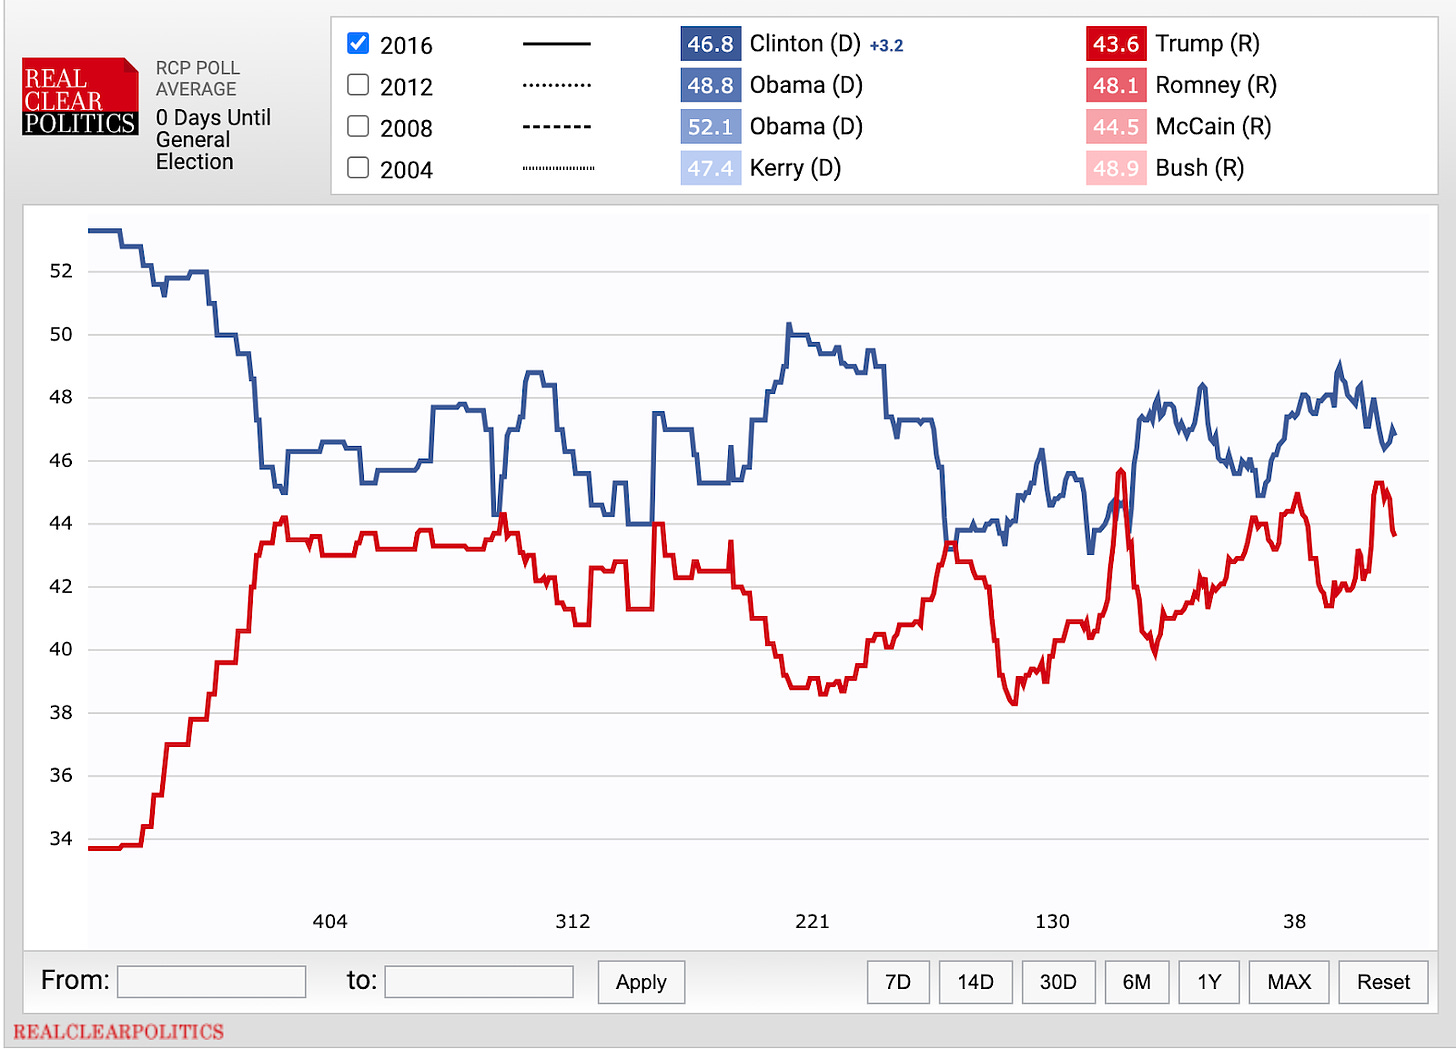
In 2016, there was much more volatility in the line — more moments when Trump pulled even or ahead.
Let’s go back a little farther, so I can demonstrate how unique the 2024 trend line is. Here’s 2012.
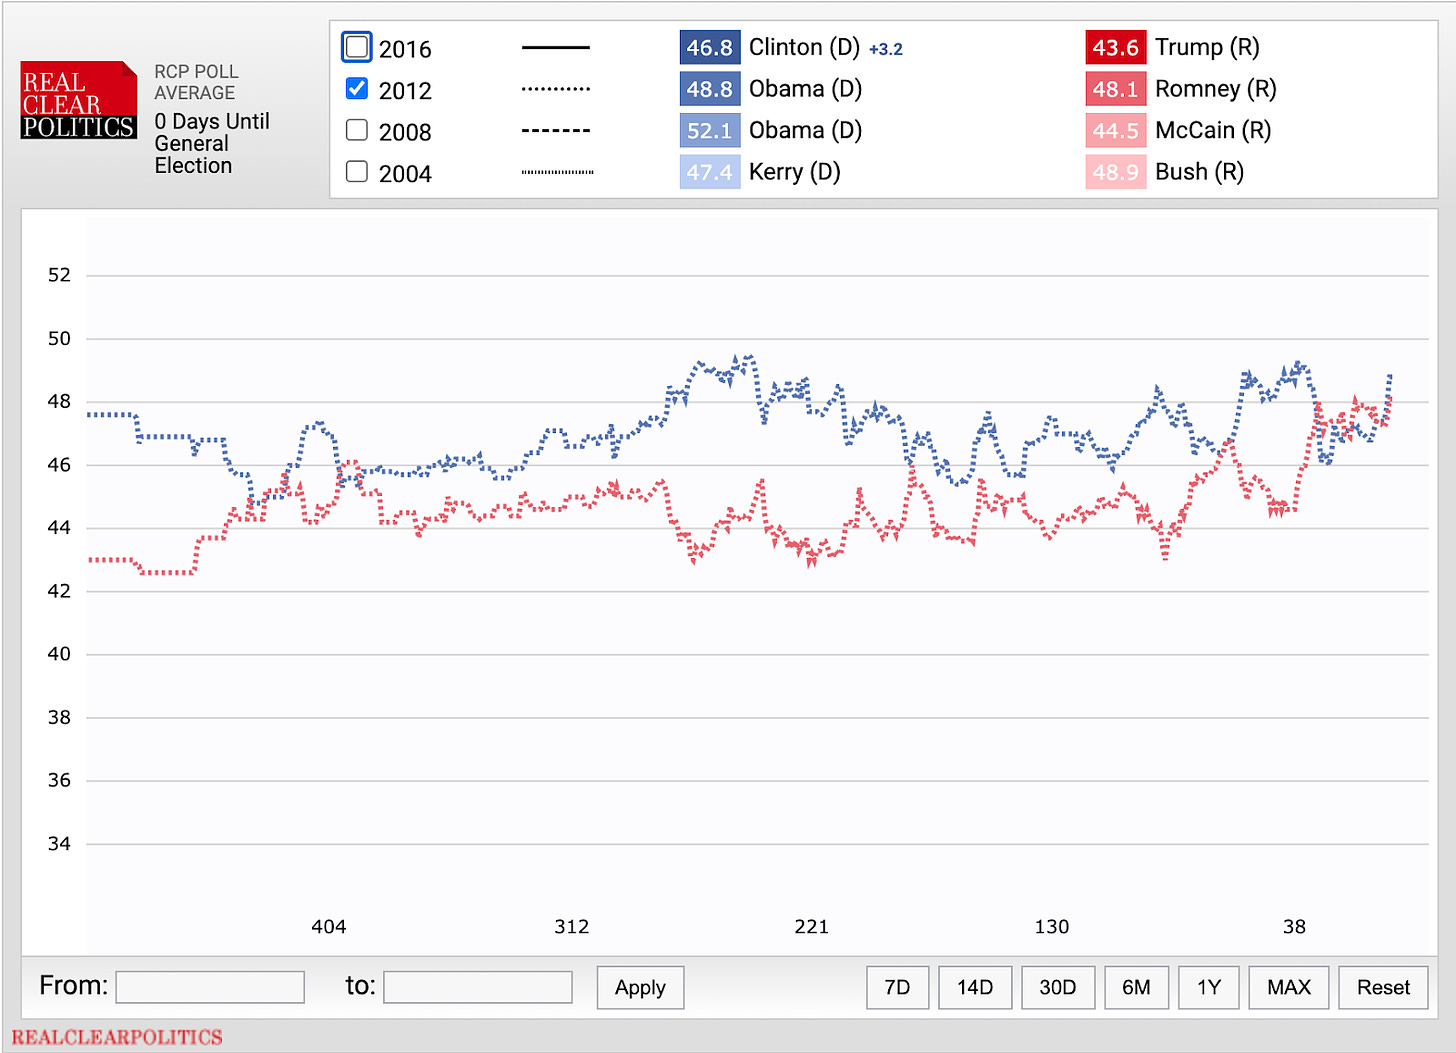
Again, in 2012, there was quite a bit of volatility in the averages. Several times, Romney pulled even or ahead.
And then, in 2008, another volatile polling season:
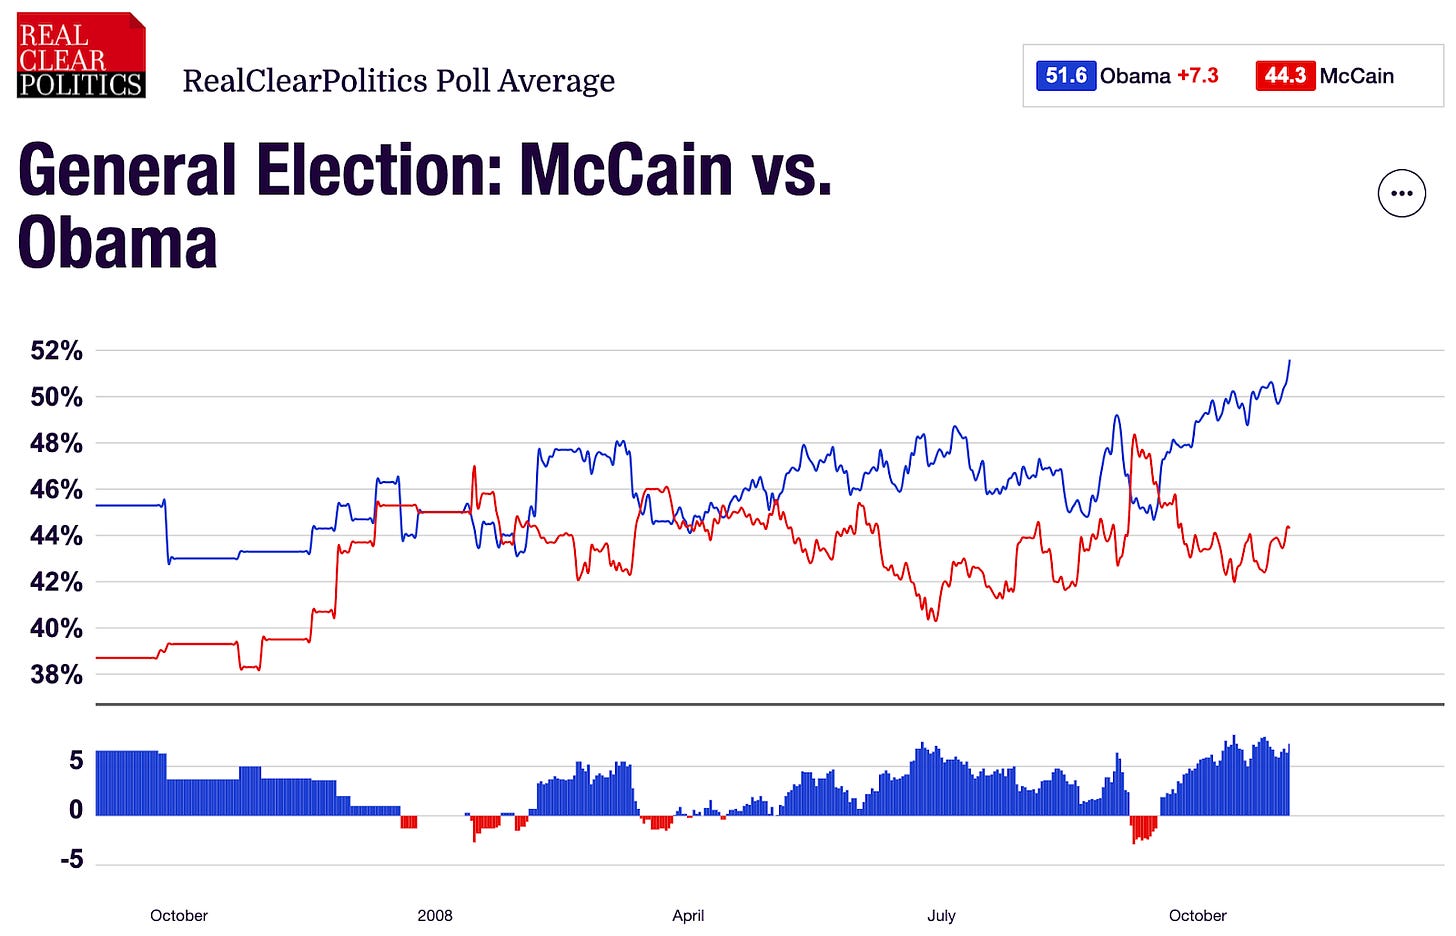
The flat line is weird. The flat line is not how the previous three elections looked. There was more volatility, more responsiveness to outside events, and more magnitude of difference between the candidates.
There is another thing we have to acknowledge. While the process of calculating a polling average is meant to account for outliers, previous polling error, and so on, we know from 2020 that the polling average showed Biden up 7.2 percentage points over Trump (51/44) on the RealClearPolitics poll average as of the day of the election. The actual result was Biden won by 4.5 percentage points (51/47). The polling underestimated only Trump.
In 2016, the RCP average had the race 46.8% Clinton/43.6% Trump but the result was 48.2% Clinton/46.1% Trump, underestimating both Clinton and Trump.
In 2012, the RCP average had the race at 48.8% Obama/48.1% Romney, but the result was 51.1% Obama/47.2% Romney, underestimating both Obama and Romney.
So when we look at the flat line, 2-points-or-less difference between the candidates in 2024, we first have to acknowledge how unusual that really is, and then we have to come to terms with this statistical reality: given that poll averages can be off by 2-5 points for one or both candidates, a lot of things can happen in a year like this one — including that either candidate could win by 3-5 points.
But if we’re looking to the polls to give us clues about the outcome of this election, based on the averages, I don’t think that top line number is going to tell us what we need to know. It is remarkably stable over time, and given the level of “panic” about “The Debate” you’d expect there to be more impact already on the averages. But you don’t see that, and there’s not much reason to believe we will see that in the next four months.
But there are other questions in polls besides the big one about candidate choice. Some of those questions show us where voters broadly agree. And I think that’s worth taking a look at.
Voters Know the Stakes and the Difference
In one of the first national polls released after the debate aired, CNN/SSRS (a pollster ranked 78th by FiveThirtyEight, a middling score, though highly rated for transparency), found this;
- 83% of respondents say it is very or extremely important to vote this year.
- 91% say there are important differences between the candidates.
This looks very much like “a choice, not a referendum” right now, but for many, the choice is already set in stone.
The Race is Stable: Rs vote R; Ds vote D
Overall, most polls show Biden narrowly trailing Trump. Even in swing states where he appears to be down by 5 points, he is statistically tied. Most polls show that even Democrats with low awareness or favorability ratings poll about where Biden does now. There’s a clear takeaway here and that is this: Most Democrats intend to vote for the Democrat, regardless of who that ultimately is.
Each party’s voters are aligned with their preferred team. The people to look at are those independents or independent-leaning voters who haven’t made up their minds yet, and those who think they could still change their minds. Depending on the poll, the undecideds who are forced to choose or say how they lean break evenly between the two candidates and not voting at all.
The job then is not that Democrats have to corral the faithful — they need to bring back the strays and grow the herd. And typically that might be something you’d expect to get by running a particularly appealing candidate.
Democrats Are Voting Against Trump (and Would Vote For Any Democrat)
The CNN/SSRS poll showed that those who are voting for Trump are voting for him (66%), but those who are voting for Biden are voting against Trump (63%).
Three-quarters of all voters say the Democrats would have a better chance with someone else. 56% of Democrats and Democrat-leaning Independents say so, too.
This isn’t new, nor is it much of a change. When Democrats were asked this in January of this year, 53% said the same thing; in March 2023, Democratic voters were split 49/49. The bald reality is that Democratic voters have never been enthusiastic about voting for Biden.
USA TODAY/Suffolk University (ranked 7 by FiveThirtyEight, a top-rated pollster) conducted a poll over the weekend immediately following the debate, showing that 41% of Democratic voters say Biden should be replaced.
One way of understanding the Biden candidacy is through the lens of his presidency: you could decide this was the only person who could have saved us from a second term of Trump and that he surprised us all and turned out to be the most progressive and productive president of many of our lifetimes. The other way to see it is that Democratic voters and activists have carried Biden across every finish line, even when they don't want to.
There is not much difference between the four candidates tested against Trump in the CNN/SSRS poll: Harris, Newsom, Buttigieg, and Whitmer are all polling about where Biden is — 42-45% against Trump’s 47-48%. We see similar results in other polling.
You might think to yourself, if you’re a Democrat, well, then what's the point? Stick with Biden if it's all the same. But the argument runs the other way too. Democrats can pick any of the alternatives if it's all the same. All of these alternatives are polling against Trump at a number at least twice that of their favorability rating. In these match-ups, it's just “Give me a Democrat, and I'll sort out who he/she is later.” Among Democrats, their preference is driven first by the party, then by the candidate.
And that means that seen another way, it’s not up to the Democrats at all — it’s up to the independents. What — or who — will get them to break for the Democratic candidate?
A Lot of Democrats and Independents Want Different Choices
A Data for Progress (ranked 24 by FiveThirtyEight, but with low-mid transparency ratings) poll conducted after the debate asked this question:
“Joe Biden is currently on track to be the Democratic nominee for the 2024 presidential election. Some people have argued that Joe Biden should drop out of the 2024 presidential election. They argue that he is too old to serve another term as president. Which of the following comes closest to your view, even if none are exactly right?”
Here’s what Democrats and Independents told them.
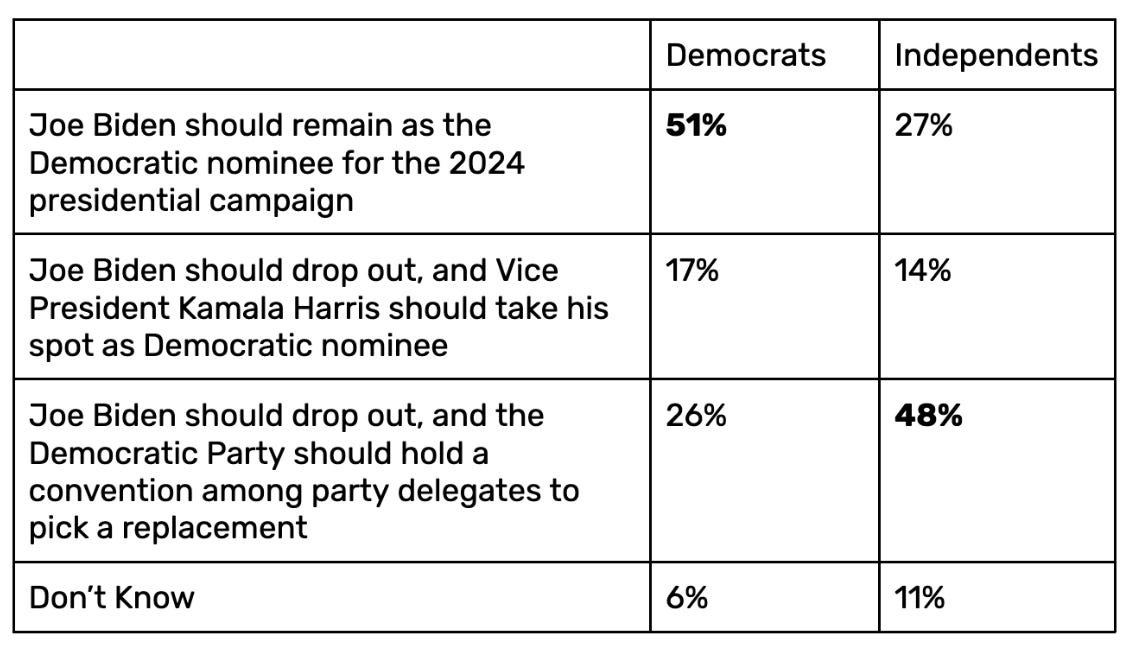
It’s 50/50 for Democratic voters — half want him to stay in, the other half don’t.
Nearly two-thirds of Independents want someone else.
Data for Progress also asked voters if they think their choices will be Biden and Trump. 22% of all voters — 19% of Democrats — still say they think it’s too soon to tell if the candidates will be Trump and Biden. That’s 1 in 5 Democrats who remain in a state of low-key disbelief that this is their final choice for president.
Biden Underperforms Democrats Running for Senator
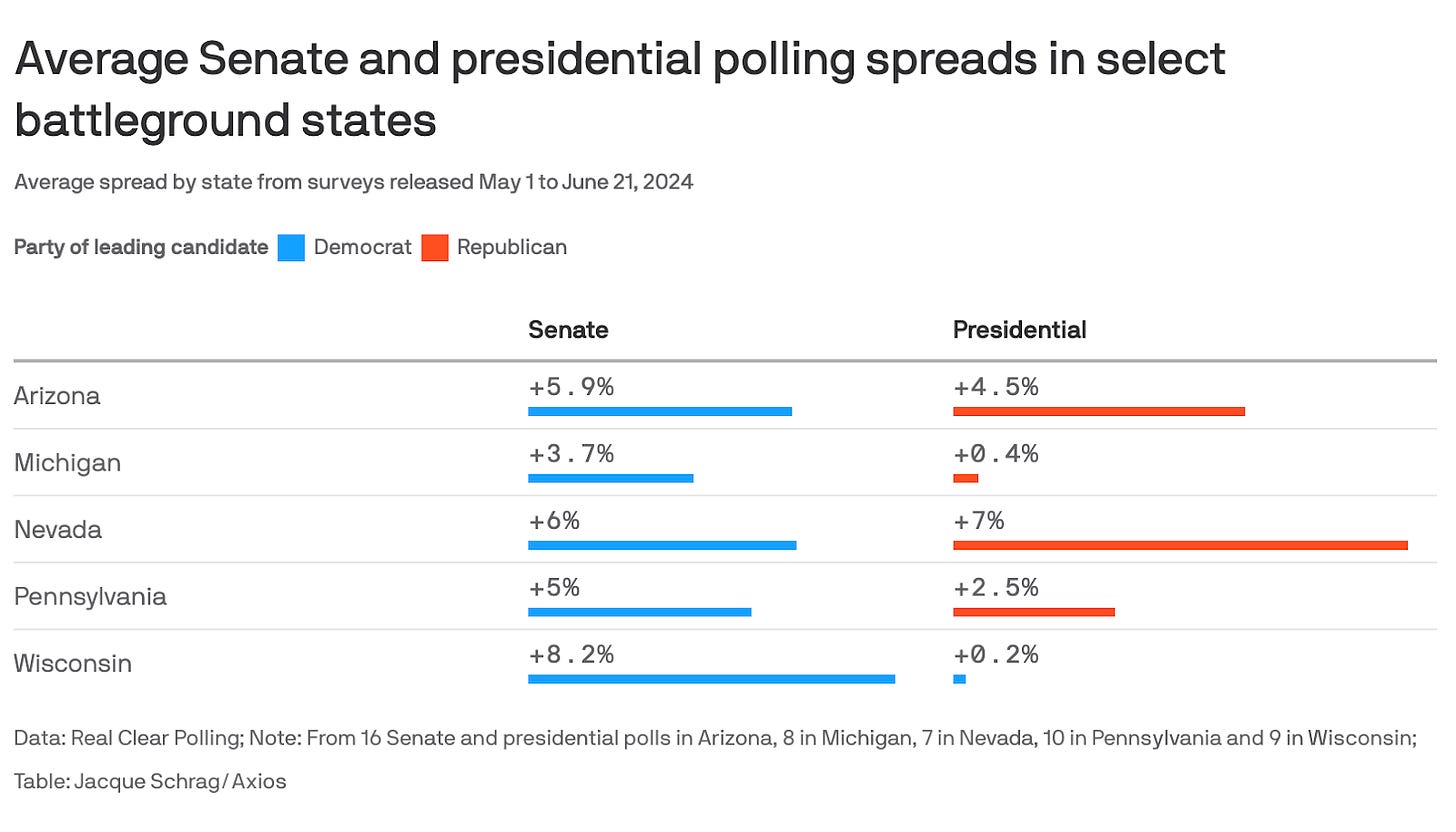
People are reasonably concerned about how Biden’s perceived strength or weakness might affect down-ballot races. However, down-ballot candidates have been performing more strongly than Biden in swing states. In the only post-Debate swing state poll from Bloomberg/Morning Consult (ranked 116th by FiveThirtyEight with a very low transparency score, and a middling score on bias/error), Biden is running behind most senatorial candidates in battlegrounds with Senate contests.
According to that poll, Biden is now down by 3 in Arizona (a 9-point deficit from the Axios average shown below), up by 5 in Michigan (ahead or even with the average), down by 3 in Nevada (a 9-point deficit from the average), down by 7 in Pennsylvania (as 12 point deficit), and in Wisconsin, he is up by 3 (a 5 point deficit with the average).
When a Presidential candidate trails Senate candidates of his own party, particularly by 5+ points, we have to try to assess why that is. Most likely, there’s a solid layer of preference for Democrats in these races. In some cases, the candidate is particularly strong, and in some cases, the contrast with the opponent is uniquely strong.
But it’s unlikely that all of these Democrats are so uniquely appealing. The Democrat brand is more likely just stronger than Biden’s brand. And his brand is weak enough that he doesn’t appear to be benefiting from some idea of “reverse coattails”, where these popular Democrats pull him up with him.
Voters See the Candidates’ Shortcomings Clearly
Biden's approval numbers are the lowest the CNN/SSRS poll has recorded — 36%, off from a high of 53% in April 2021, shortly after he took office. While his “approve strongly” numbers have stayed in the low teens since January 2022, his “approve moderately” numbers have wavered but generally declined over the same period — from 27% to 21%.
Those who are ridin’ with Biden are where they've been since November 2021, give or take; within the first year of his presidency, his strong approve/moderately approve numbers flipped (53/19 to 15/33). But since the beginning of 2023, when it was clear Biden would seek reelection, his “strongly approve” numbers went low and stayed steady (12-15%), while his moderate numbers declined from 32% in December 2022 to 21% today. Conversely, his strong disapprove number is at an all-time high — 45% of voters said they disapprove strongly of how he is doing his job as president.
Trump's favorability is also abysmal — and it always has been. The only time he reached a 50% favorable opinion in SSRS polling was in 2005. For nearly 20 years, his favorability rating has hovered at an average high 30s. People don’t like him. Even the people who say they’ll vote for him.
The CNN/SSRS poll asked an open-ended question, “What would you say is the most important difference between (Biden) and (Trump)?”1
The top-rated characteristics:
- Honesty/Integrity: 17%
- Ability to handle the job/Mental fitness/Cognitive abilities/Intelligence: 15%.
This underplays the differences a bit. The question is open-ended, which means people could say or type whatever they wanted, so the analysts had to “code” the responses by labeling categories of responses in ways that feel descriptive, inclusive, and also distinct. The numbers don’t add up to 100% because people may have cited multiple ideas in their open ends, even though the question is about “the most important” — look, people don’t always follow the instructions.
But there are some bigger buckets into which we can pour an array of characteristics.
Bucket #1: Integrity – 70% mentioned related characteristics

Bucket #2: Competence – 39% mentioned related characteristics

Bucket #3: Policy Positions – 28% mentioned related characteristics

Candidates talk a lot about drawing the contrast between themselves and their opponents. The contrasts have been drawn. What matters most to people is their perceptions of a candidate’s integrity and competence, and that includes their physical and mental capacity.
So Let’s Get Real About the Age Thing
When voters were asked about reasons to vote for or against Biden, there were more reasons to vote against him than for him. The biggest reason to vote against Biden is this: “His level of physical and mental ability” (72%).
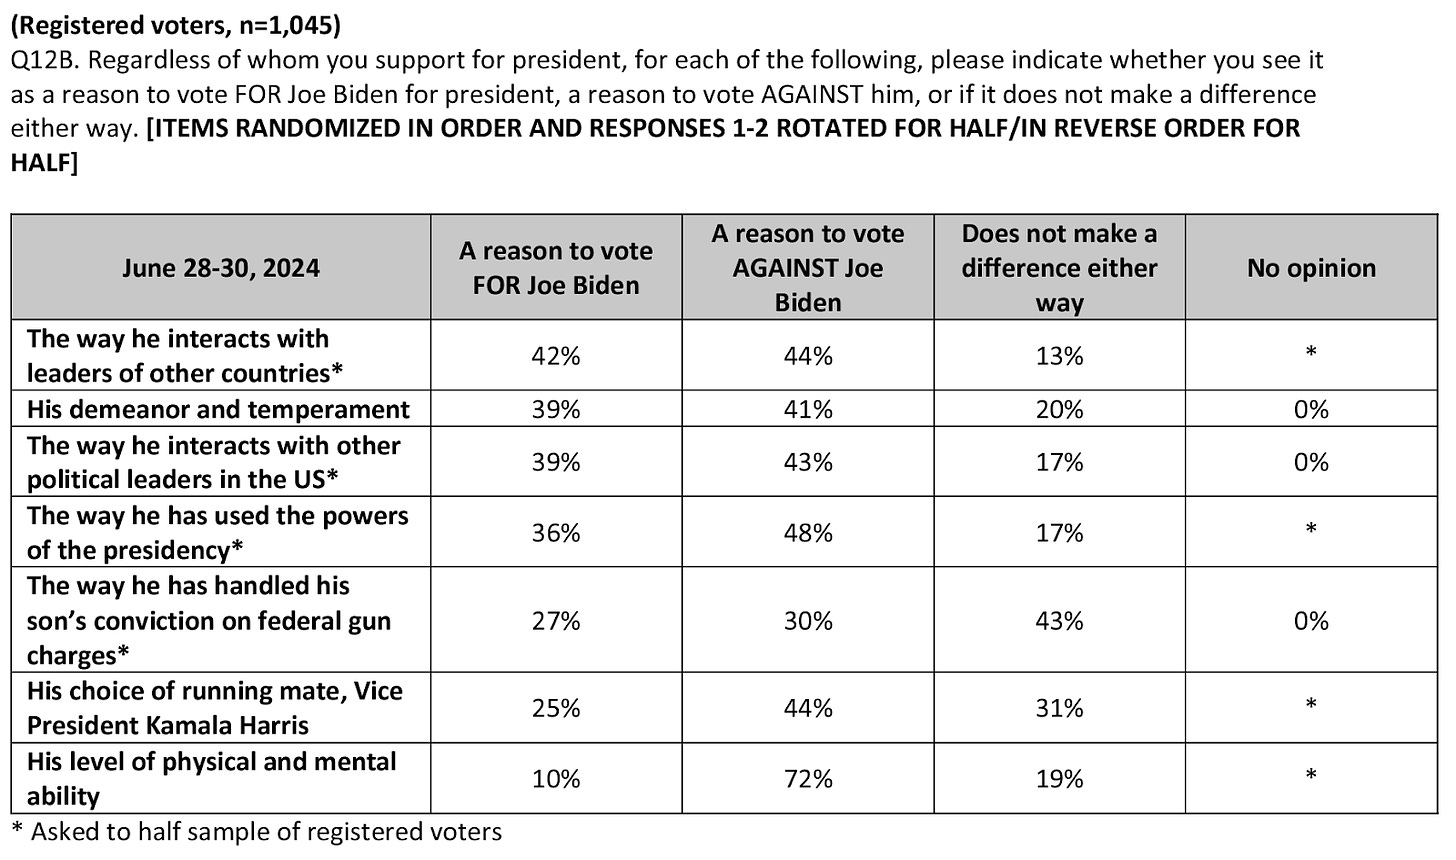
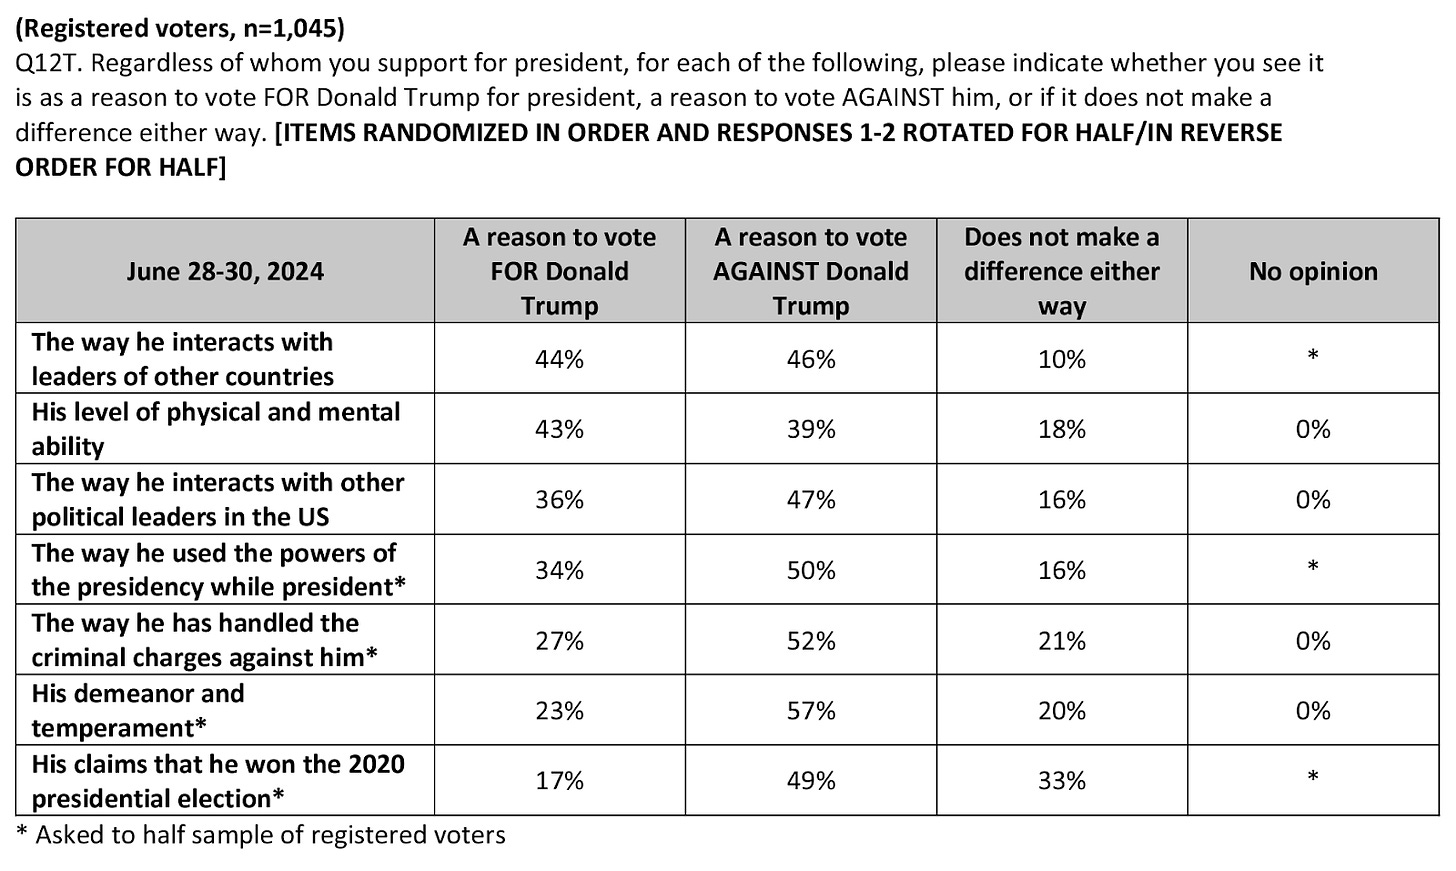
People are less ambivalent about Trump; 57% say “his demeanor and temperament” are a reason to vote against him; 52% say it's “the way he has handled the criminal charges against him”; 50% say it's “the way he used the powers of the presidency while president”; 49% say it's “his claims that he won the 2020 presidential election” (33% say that doesn't make a difference).
This isn’t new. And it’s not inconsistent.
All the way back in June 2020, NYT Siena (number 1 pollster in the FiveThirtyEight rankings) asked about Biden's age.
- 36% strongly or somewhat agreed that Biden was just too old to be an effective president. 18% of Democrats agreed.
- 85% said it would make no difference either way if Biden pledged to be a one-term president. 87% of Democrats agreed.
In a December 2023 Wall Street Journal poll2, only 14% said Biden had the most physical stamina to be president. Just 29% said he was more fit mentally to serve as president.
Since the start of 2024, NYT Siena has asked if voters think Biden is too old. 74% of voters in this week’s poll say yes. 59% of Democrats say so. 61% of those who say they intend to vote for Biden say so.
The Data for Progress poll showed that, among Democrats, 43% agree that Joe Biden is too old to be president. That number went up 6 points from March. For proof that this is not a question of absolutes (yes, Trump is not much younger), and is instead a question of comparisons, the percentage of Republicans saying Trump is too old went down 6 points from early March; the percentage of Democrats saying Trump is too old only went up 1 point. This is one of those things where perception is reality.
Strategically, Where Are We?
Let’s stipulate:
- Everyone agrees it’s important to vote this year.
- Most people have their minds made up.
- And everybody knows there are important differences between the two candidates.
One is old and unable to bring down prices or interest rates in an otherwise growing economy. The other is an intemperate, volatile, corrupt, insurrectionist felon who made a hash of managing a pandemic and then lost the popular vote by 4.5%, a comparative landslide given our politics.
And as I look at the polling versus the record, the likeability, and the voters’ assessment of their qualities and capabilities, a single question comes to mind:
Why is it close?
- Why, if “all it is” is age, can your candidate only occasionally pull ahead in public polling?
- Why do 40+% of Democrats wish someone else was the candidate?
- Why do so many Democrats agree that your candidate is too old to do the job?
- Why, with the stakes so high, will 20-30% of eligible voters stay home this year?
Both candidates are incredibly unpopular but the bases of both parties are pretty locked in. So a tight election that will be made up on the margins means that candidate choice for the independents, the undecided, and the unlikely will be the determining voting segments. And there we simply don’t have enough data.
What Polls Aren’t Telling Us
As a researcher and a strategist, here’s what I’d want to know:
- What are the actual drivers of choice when it comes to voting in this election? Why do they vote (or not), select a preferred party (or not), select a candidate (or not)? What characteristics, positions, policies, or other factors are most important to people when deciding how (and if) to vote for a president? What are people most worried about, and on what sort of timeline?
- Given how closely run elections are, and how hard of a time pollsters are having in measuring public opinion about their candidate preferences, what do we need to rethink about how we model the electorate? How should we think about the undecided or unlikely voters?
- Given that people get “news” from a lot of sources that might not be considered to be “news”, how do we understand the flow of information from authoritative sources, professional influencers, entertainers, and propagandists, and how this shapes voter’s perceptions of elections, candidates, parties, and their own votes? There’s a lot of hope that people didn’t “see” the debate, or that it will eventually fade from the so-called news cycle — but is that the right way to think about messaging and candidate performance in this media environment?
As we watch the parties go through their paroxysms of change — one party captured by a populist right-wing, the other in crisis over a weak candidate — we may also want to start investigating whether our model of what drives candidate selection, what drives the decision to vote, may be out of date.
The one thing I know for sure is that nobody knows anything.
1 The names are in parentheses because they were rotated, so half of the sample saw Biden first, and half saw Trump first, to avoid order bias.
2 The WSJ poll is run by a partnership between GBAO and Fabrizio Lee & Associates. FiveThirtyEight ranks GBAO 22nd with very low transparency scores because they are a partisan pollster; Fabrizio Lee is ranked 13th, with low transparency scores and a slightly better rating on bias/error.