Friday Polls - Make It Make Sense


Members of the Biden campaign, including Biden himself, have told the press they believe that "polling is broken." It's hard to say which part of polling they have issues with, or whether they simply don't like it. It's not unusual for Presidents and presidential candidates to have love/hate relationships with the polls. But maybe there’s something to it. Some questions in presidential polling that were good predictors of voter support stopped performing over the past 15 years. The most frequently cited reason for this change is polarization, which may also drive the decoupling of economic indicators from presidential approval ratings.
We’ll look at cross tabs of registered voters in the last two NYT/Siena College polls (ranked highest by FiveThirtyEight) to see which groups are pulling up – or dragging down – certain numbers. And then we'll reflect on the story we're not getting from these polls.
Right Track/Wrong Direction
Between the February and April polling conducted by NYT/Siena College, the topline number for the question "Do you think the United States is on the right track, or is it headed in the wrong direction?" is essentially unchanged. But there is movement by some subgroups.
- Gender: Women shifted 5 points towards the "right track". Men stayed essentially the same.
- Age: The 45+ shifted 4 points towards the "right track."
- Race + Education: White, college-educated voters shifted 5 points towards the "right track."
- Region: Voters in the midwest shifted 7 points towards the "right track."
- 2020 Vote: Voters who chose Trump in 2020 shifted 7 points toward the "wrong direction".
Here is the partisanship some political scientists theorize now drives this number. When you look at the numbers for this question by party ID, Democrats are about evenly split: 43/41 right track/wrong direction. However, Republicans are nearly unanimous that the country is heading in the wrong direction; in the April release, 88% of self-identified Republicans and 92% of those who voted for Trump in 2020 think the country is headed that way.
So when you look at the top line number showing 25% right track, and 64% wrong direction, you should understand that number to be highly partisan.
"If the election were held today..."
Here the question is, "If the 2024 presidential election were held today, who would you vote for if the candidates were Joe Biden, the Democrat, or Donald Trump, the Republican?" This number changed putting Biden and Trump in a dead heat, only a percentage point between them. But the cross tabs have a story to tell.
- Gender: Women shifted 6 points in favor of Biden; men shifted 8 points in favor of Trump.
- Age: Biden lost 7 points with 18-29-year-old voters, as they shifted 4 points for Trump and 4 points for "don't know/refused". Biden gained 7 points among the 45-64 age cohort and held steady with the other age groups.
- Race alone: Biden showed a modest gain with Black voters and a 10-point gain among Hispanic voters.
- Race + Education: Biden gained 8 points among non-white, college-educated voters who shifted almost entirely from the "don't know/refused" column. He also gained 10 points among non-white, non-college voters.
- Region: Biden shows an 11-point gain among voters in the Northeast and a 6-point gain among voters in the West. Trump's greatest losses were in the Midwest.
- 2020 Vote: Biden gained 6 points among his 2020 voters; Trump declined slightly among his. But overall, 89% of those who voted for Biden in 2020 intend to vote for him again, and 94% of Trump 2020 voters intend to vote for him this time.
Once again we see how partisanship affects these outcomes. Sorting on party identification, 88% of those who identify as Democrats intend to vote for Biden; 90% of those who identify as Republicans mean to vote for Trump. It appears that the process of a party’s voters “coming home” as they near election day is underway.
Presidential Approval
The net approve/net disapprove numbers haven't changed much, though there’s a slight shift in Biden's favor now showing at 38% approve/59% disapprove.
- Gender: Women shifted 7 points in Biden's favor here, while men stayed mostly put, slightly shifting more towards disapprove.
- Age: 45-64 year-olds who shifted 7 points towards Biden as their candidate of choice, also shifted 6 points up in his approval rating.
- Race alone: Hispanics' presidential approval of Biden shifted 7 points towards favorability, tracking with their candidate preference.
- Race + education: Non-white college-educated voters shifted 7 points into the net favorable camp, tracking their candidate preference, as did non-white non-college voters.
- Region: The Midwest has a 7-point more favorable view of the President, and the Northeast has a 4-point more favorable view. Interestingly, nothing changed for the West, despite their shift towards Biden in candidate preference.
- 2020 Vote: Biden gained 5 points of approval among his own voters and 3 points of approval among Trump's voters. Those who did not vote in 2020 shifted 8 points for Trump. This continues to support a narrative of Trump's strengths among unlikely voters.
93% of self-identified Republicans disapprove of Biden. 72% of Democrats approve of him. Republicans have selected their team, and it doesn't wear blue. Biden has to consolidate Democratic support which, I know, is 🚨breaking news.🚨
Favorability
The question: "Tell me whether you have a very favorable, somewhat favorable, somewhat unfavorable, or very unfavorable opinion of Donald Trump/Joe Biden."
Trump's net favorable rating is unchanged at 43 favorable/55 unfavorable. Biden's rating slightly improved to 41 favorable/56 unfavorable (from 38/59).
- Who did Trump improve with?
- Men (5-point shift)
- 65+ (8-point shift)
- White college-educated voters (7-point shift)
- Who did Biden improve with?
- Women (10-point shift)
- 18-29-year-olds (7-point shift)
- Black voters (6-point shift)
- Hispanic voters (22-point shift!!!) [NB: I suspect a sampling error.]
- Voters in the West (7-point shift)
- And he improved 7 points with his 2020 voters.
Trump has a net favorable score of 86/13 among self-identified Republicans, gaining a few points since March. Biden has a net favorable score of 82/17 among self-identified Democrats, showing no movement from last month.
If we only look at Biden’s ratings here, we can see something that annoys the heck out of some people:
- 88% of Democrats say they'd vote for Biden if the election were held today.
- 82% of them have a net favorable view of Biden.
- 72% of Democrats approve of the job he's doing as President.
- 43% of Democrats say the country is on the right track.
See the drop-off? Many people either don't think it's the President's fault if the country is headed in the wrong direction, or don't think he makes much difference.
Back to Right Track/Wrong Track as an Indicator
Despite being able to explain the low "right track" top line number as driven almost entirely by party allegiance, it helps to look at historical numbers for context. Gallup asks the question slightly differently, "In general, are you satisfied with the way things are going in the United States at this time?" (Their data goes back to 1979.)
Trump entered office with the country being 26% satisfied. The highest satisfaction score under his tenure was 45% the month before the pandemic hit the US.
The lowest percentage of satisfied Americans since Biden became President was 11% in January 2021. The highest was 36% in the early summer of 2021.
The current satisfaction score is 23% (March 2024).
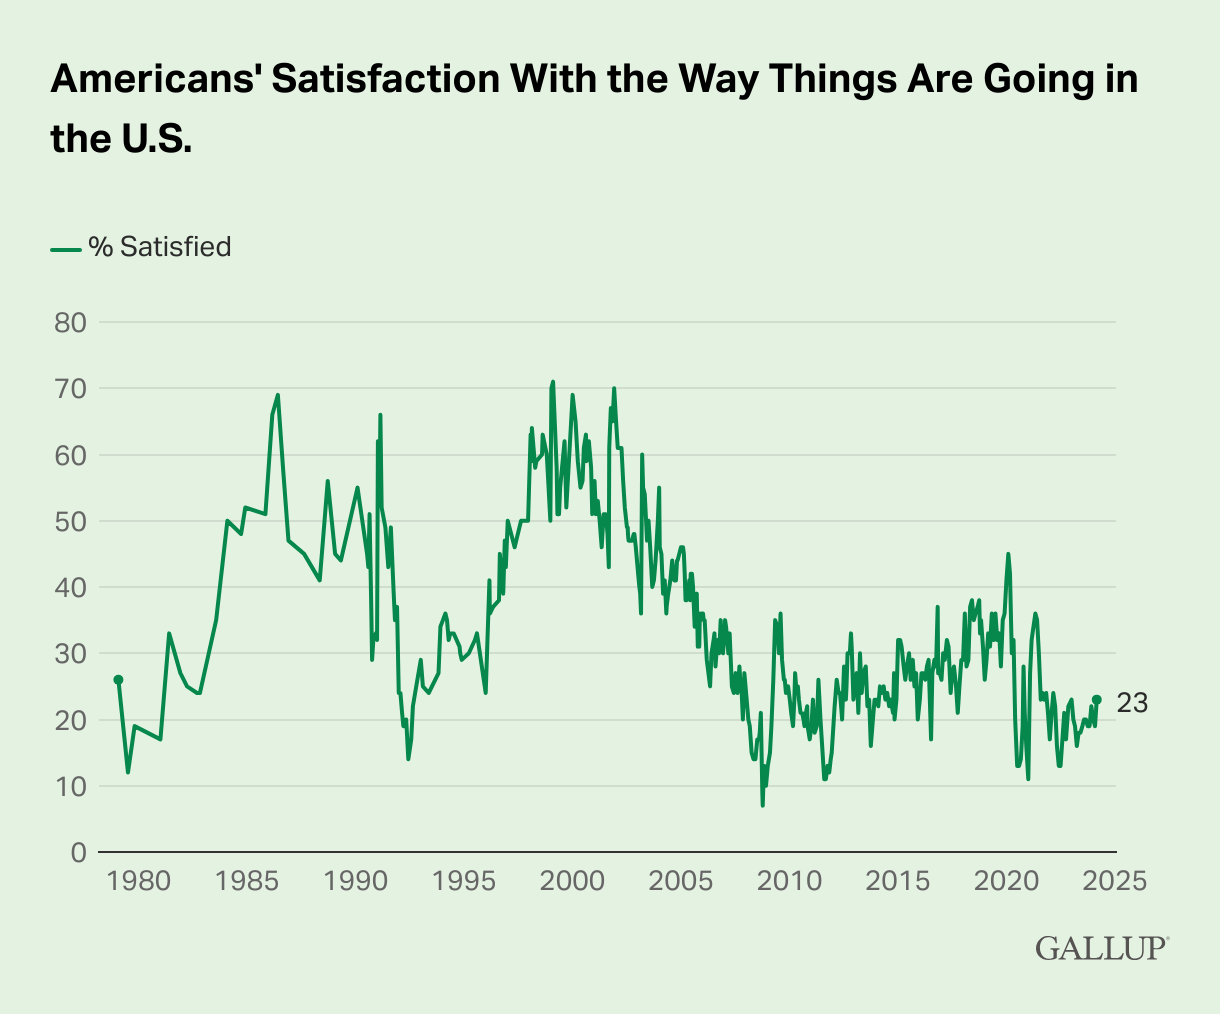
If we pull back on the timescale, we see that the satisfaction score has been low since the 2008 financial crisis. It hasn't been above 50% since January 2004. Prior to 2008, low satisfaction scores consistently favored challengers, and high satisfaction scores consistently favored incumbents.
For years, this question was a catch-all for economic indicators including employment and inflation. But since the financial crisis and the inauguration of President Obama, this question has not matched voter’s assessment of the economy. And their assessment of the economy no longer correlates perfectly to their presidential preferences.
It’s not great that so few are satisfied in the United States. Certainly, an incumbent President would not want to see the numbers in the 20s as he seeks reelection. But it seems a President’s job performance or likeability is mostly unrelated to how voters perceive the country’s trajectory. Something else is going on in voters’ minds. But these polling questions can’t tell us what that is.
References
- “Why isn’t Joe Biden getting credit for the economic recovery?” (Vox)
- “Presidential approval and macroeconomic conditions: evidence from a nonlinear model” [PDF]
- “Whither Presidential Approval?” [PDF]
- “Chapter 13 Weakened Ties: The Economy and Presidential Approval in the Twenty-First-Century United States” in Economics and Politics Revisited: Executive Approval and the New Calculus of Support [Log-in required]