Friday Polls - Comparing Methods


Opinion Today is one of my favorite substacks (recommended to me by our guest Mike Podhorzer). It's a great round-up of headlines about polls, commentary on the polls, and occasionally includes podcasts about polling (Cross Tabs has been mentioned twice, which is very nice).
As I looked through the reporting Opinion Today compiled today, it seemed interesting to compare sample sizes, methods, and margins of error. Why? Because I think many poll consumers and pundits about polls still believe that a poll's sample error is:
(a) the only margin of error in a poll, and
(b) solely a function of the sample size.
I promise at some point to give you a little rant I have cultivated over the years about why you should not describe a sample size as "statistically significant" [stares in Dan Pfeiffer of Message Box and Pollercoaster]. That is a concept that isn't applied to the size of the sample. But I'm not going to do it today because my head is thick with this cold I have, and my temper control is thin.
Anyway – here's the comparison.
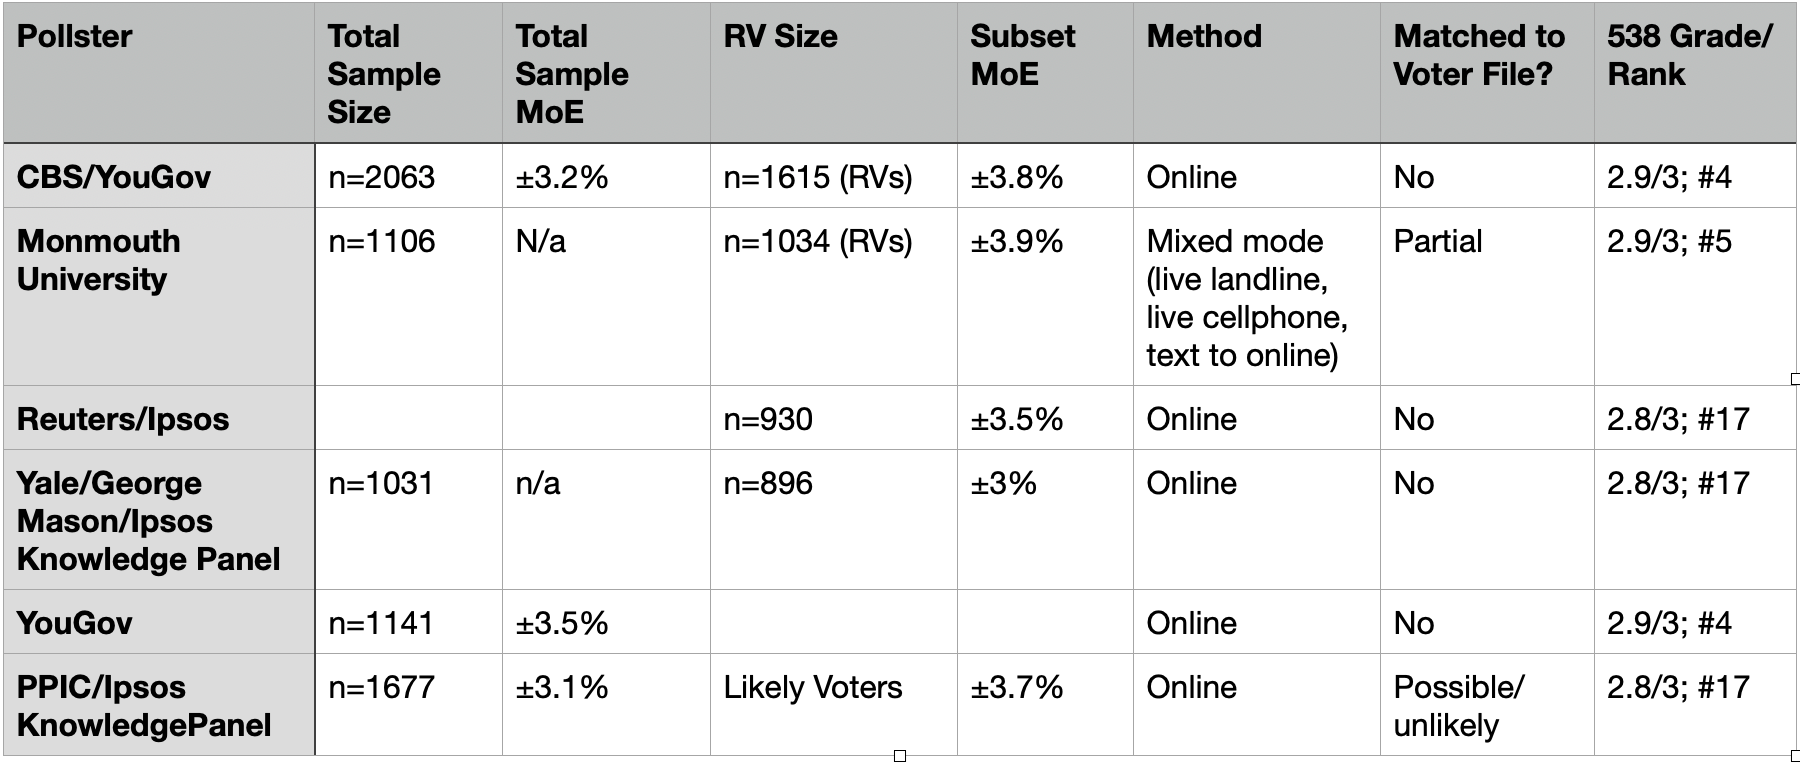
The sample sizes vary from as few as 896 respondents to 2063 respondents; they might include registered voters or likely voters; they might be California only; they might be online only or mixed mode; they might offer a Spanish language version or not; they might match to voter file or compare to it; they might have to do a lot of weighting or a little to make the sample representative. But the ranges of MoE are ±3-3.9%.
Notice something: A sample of 1034 registered voters can be assigned an MoE of ±3.9%, while a sample of 1615 (60% more participants) can be assigned an MoE of ±3.8%. Meanwhile, a sample half that size has a much narrower margin of error. Why?
Because it's not (merely) a function of sample size. Let's set aside that none of these MoEs are "right"; we know from Nate Cohn: when you hear 3, think 7.
Why Methodology Sections Are Fun
If you've listened to the show you've heard a pretty consistent refrain of advice: don't be afraid of the methodology section. Look for transparency from pollsters.
Obviously, I did that with these handful of studies.
- CBS/YouGov poll:
- They published their topline.
- They also noted that they oversampled Arizona, Georgia, Michigan, Nevada, North Carolina, Pennsylvania and Wisconsin.
- They weighted by US Census American Community Survey and Current Population Survey; they also weighted by self-reported past vote (2020 General and 2022 Congressional). There is no clear indication that voters are matched to the voter file.
- They did not publish their weights, nor question-level MoE in the crosstabs. They did include them in the charts presented in the accompanying article. Some questions reported MoE around ±4.5% and some ±6.5% (on a question for Republicans only).
- Based on this fluctuation in MoEs, there is a suggestion that the Republican non-response bias continues to affect subsample sizes and potential for error among this group.
- Monmouth University:
- They published their crosstabs.
- They publish a fairly extensive description of their methodology, including sample sources, sampling methods, and survey modes.
- They publish their weights, which reveals underrepresentation in groups we would probably expect: Republicans, 18-34 year olds, non-white respondents, non-college respondents, and therefore applied weights to these subgroups; therefore in the cross tabs, margins of error for those demographic groups is around twice the size of the total survey MoE.
- While they employ a probability sample approach (RDD via Dynata, Aristotle-provided registered voter list) supplemented with their own prior contacts, they also apply a non-probability selection method for choosing who to interview in a household with multiple adults (they interview the youngest adult). It creates some efficiencies, still provides representativeness, but reduces the randomness a bit.
- Reuters/Ipsos:
- Reuters did not publish the cross tabs, weights, or subsample sizes.
- They do not publish their methodology in the article; many news outlets do this, linking to a page about the general approach to conducting research with an average MoE.
- In the article they refer to the MoE as "roughly ±3%"; the methodology page says typical surveys in this range of sample size have a MoE of about ±3.5%
- Yale/George Mason/Ipsos:
- This report publishes the full report, with a lengthy methodology section.
- But again, based on the subgroup MoEs, the usual suspects were underrepresented in the sample:
- Independents and moderate Republicans
- Non-college and less affluent respondents
- They also chose to run banners by generation so they could draw conclusions about one generation's attitudes to climate change versus another's. However, always be cautious here: there were only 66 Gen Z respondents v. 336 Boomers. And I'd turn their attention to Pew's decision to use generations sparingly.
Key takeaways from this nerdy exercise:
- Remember to double the reported MoE in your head.
- Don't get too attached to the sample size. When you get out of the topline number (total respondents), the base sizes for any subgroup, including questions where only some respondents could answer, will drive the margin of error up considerably; that margin will also be affected by how much weighting had to be applied to that group to make it representative. Things start to get fuzzy.
- The gold standard for sample starts with a randomly selected, representative sample. When you're trying to say something about registered voters, the gold standard is to match your respondents to the voter file. Look for the polls who aim for these standards.
- Look at the weights with curiosity. When the weights don't match reality, be skeptical. One of these surveys applied weights that still overrepresented the highly educated and affluent in their study.
Why does any of this matter when the race is so close?
I'm not here to unskew any polls or engage in whatever "crosstabs trutherism" is. I am here to tell you that all polls are flawed, and none are actual ground truth. All of them are simply snapshots of models of the electorate. Understanding how those models are built matters – those models give voice to some voters more than others, underestimate opinions and preferences for some groups, and can either elucidate or obscure what's going on within our polarized electorate.
What if you're not in politics?
Well, first of all – nobody's not in politics. Even if we don't vote, other people's choices will shape the choices that are available to us.
But let's say you're reading this because you are in market research, or user experience research – you should know more about the method and the math behind your surveys. You should ask more questions about how much stock you should put in any one question, or one form of analysis. You should push your research partners to improve their data quality and sample designs.
It doesn't do anybody any good to speculate about the people you really want to influence, but not actually get a chance to ask them what they think, feel or do.
Have a great weekend.