Friday Polls - 30 Day Makeover
Correction to the previous edition - wrong headline, but ... the substance of the post is still good.


An outlier polls caught the eye of pundits, but how much stock should we put in a new poll from Pennsylvania showing Biden up 10?
CORRECTION: Hi - the headline that went out with this post was wrong. That's my fault. I started writing this post based on an article I found that cited the March edition of the Franklin & Marshall poll in the text of the article, but linked to the February edition of the same poll. But as I kept digging and writing, I realized I was compounding the error made by someone else. The rest of the post reflects the reality – that poll really did say Biden is up by 10 in a head-to-head matchup. But there's a lot more to that poll than the headline, so ... my apologies for not realizing that when I hit send I had not updated the headline.
Happy Friday - I'm going to start doing a weekly email on Friday afternoons. I'll talk about the methodology or the reporting on a particular poll. I'll define a key term in survey methodology. And I'll tell you what's cooking for the next episode of the show.
By the way - there are only a few of you who subscribe so far (hello i love you). Would you do me the big grand favor of forwarding this on to someone else you know who...
- Is an absolute nerd for political polling. Election years are their World Series. Gets alerts for 538 or RCP polling average changes.
- Freaks out about every poll because it spells inevitable doom for whatever outcome they want. Plans to rely on their favorite polling average to predict the future.
- Is genuinely curious about what polls mean, but really, who's got the time?
- Works in market research, polling, campaigns, or strategy.
- Covers the polls as a journalist or commentator or youtuber or whatever.
Thanks!
Poll of the Week: 30-Day Makeover in Pennsylvania?
They talked about it on Morning Joe. Newsweek says Biden "crushes" Trump. The Hill reported it this way:
The Franklin & Marshall College poll found Biden garnered support from 48 percent of voters surveyed, compared to Trump’s 38 percent. Meanwhile, 13 percent of voters surveyed said they preferred to vote for “someone else,” and the remaining 1 percent said they did not know who to vote for.
And RealClearPolitics say this poll shifted their polling average 0.1 points, even though they say it may be an outlier.
The nice thing is that Franklin & Marshall publish their poll findings, so we can read the full report, and the topline. We can compare this poll to previous polls in February of this year, and October of last year. We can also compare the press releases the college puts out to see what they choose to emphasize, and what they don't.
Okay, so what does this poll say, according to their own press release?
President Biden leads Donald Trump in Pennsylvania, 48% to 38%, in a one-on-one matchup, but his advantage is smaller, 42% to 40%, when third party candidates are included.
First we have to acknowledge the other answers in the poll, and to get that information, we need to look at the topline numbers.
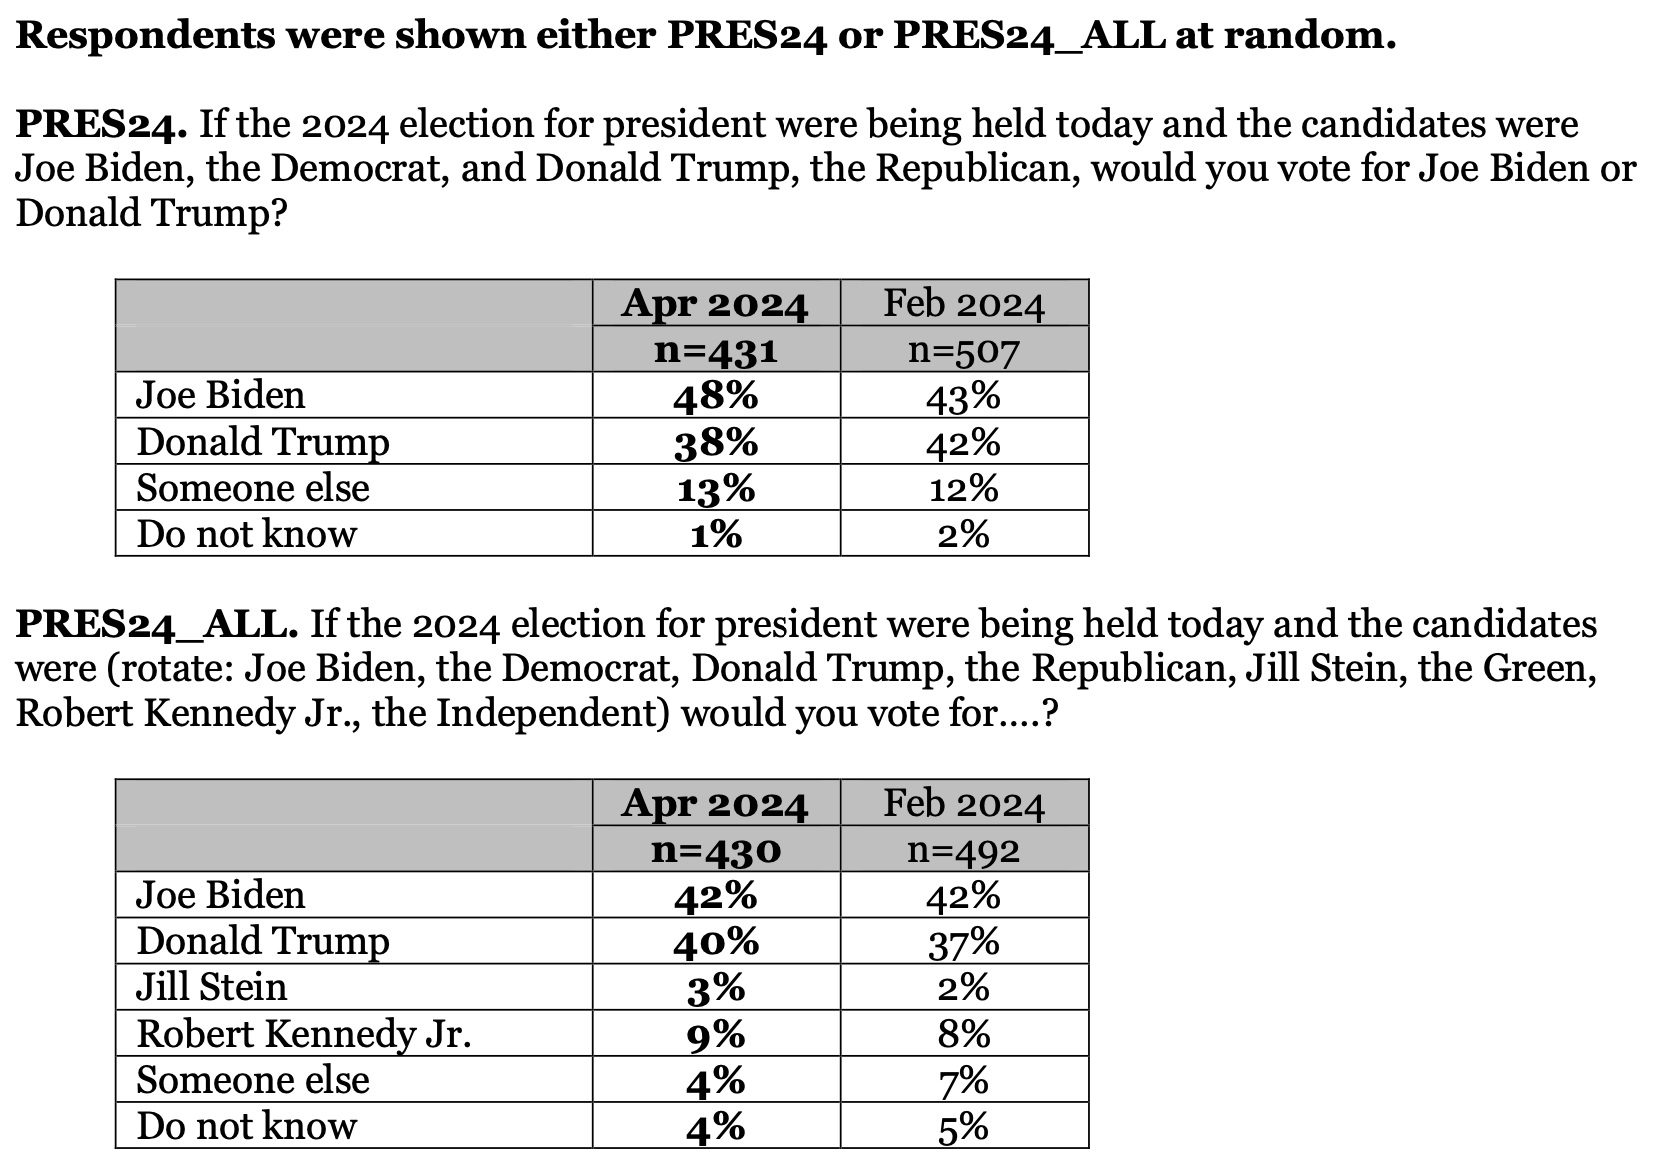
This poll would seem to suggest that the 5 point gain for Biden over the February poll came entirely out of Trump's share of the Pennsylvania electorate. But there's something else that stands out to me. In the head-to-head comparisons between the two surveys, Biden gets his share from Trump; but in the multi-candidate experiment, Biden's share doesn't change while Trump's—and everybody else’s bumped up a little.
In February, Trump was 5 points behind Biden in the multi-candidate experiment, appearing to lose that share to some combination of Stein and Kennedy, "Someone else", and "Don't Know". In the February multi-candidate experiment, the number of people saying "Don't Know" was twice as large as the head-to-head; those choosing "someone else" in the head-to-head appear to choose Kennedy or Stein in the multi-candidate experiment.
That's not what appears to have happened in March, though. Rather, Trump does a bit better in March than in February; while Biden, Stein and Kennedy remain almost unchanged. So he would appear to have gained among the "Someone Else" contingent.
A few observations comparing cross tabs:
- Biden gained 2 points from February among registered Republicans, 2 points among registered Democrats, but lost 3 points of support among Independents.
- Trump lost 12 points from February among registered Republicans, 2 points among registered democrats, and gained 10 points of support among Independents.
- Almost triple the percentage of Republicans chose "someone else" in March versus February. Democrats preferring "someone else" or "don't know" dropped 4 points. Independents preferring "someone else" or "don't know" dropped 8 points.
- There were substantive shifts towards Biden among those who identify as Liberal (83% of Liberals choosing Biden in February, 96% choosing him in March), but also shifts away from Biden among Moderates (57% in February; 51% in March). Moderates also shifted more in favor of "someone else" from February, from 12% to 17% in March.
- Women also shifted significantly towards Biden - 54% of them chose Biden in March versus 45% in February. Men did not change their minds across any of the candidates.
- Trump lost about 8 points among the 35-54 demographic, and lost about 8 points among those over 65. The under-35 demographic didn't shift. The 35-54 age group shifted to "someone else" and not to Biden; the 65+ group shifted to Biden.
- Trump lost 15 points among those with a high school diploma, equivalent or less. Biden gained 9 points among that group; the remainder prefer someone else.
- Biden gained 7 points among those with some college; Trump held steady, so these gains came from people choosing Biden over someone else, and fewer becoming undecided.
- Biden gained 4 points among White voters; Trump lost 6 points among White voters.
- Biden gained 4 points among non-white voters, and so did Trump. These gains came from chiefly from the "someone else" voters in February.
- Biden gained 8 points among white non-college voters; taking it all from Trump's supporters in February. But Trump also lost 6 points among white college voters to "someone else" and undecided.
- Retirees swung for Biden between February and March, showing a 7 point gain for this group, and taking this share almost entirely from Trump.
- Those earning less than $35,000 really changed their minds. 35% of them chose Biden in February, but 53% of them chose Biden in March. He also gained among those making between $35-75,000, improving with this group by 10 points. There was no change among those making more than $75,000.
- Biden support improved significantly in Philadelphia and the southeast collar counties, going from 57% in February to 62% in March. He also improved in Allegheny County where Pittsburgh sits by 7 points.
- Biden also quadrupled his support in what are called "noncore" counties in the urban-rural classification. Noncore means there are no towns or cities with more than 10,000 people living in them in the county.
Okay, so what does it mean - what explains this seemingly huge shift?
You're going to hear a lot of commentary about this. There will be stories about Democrats coming home; there will be stories about how Biden is not in trouble with the liberal wing and younger voters and voters of color, actually; there will be stories about how the IVF rulings and the SCOTUS hearing about Plan B shifted women towards the Democrats; there will be stories about improving economic conditions – or just more political engagement – for low-income, rural and non-college voters; you might even see more stories about how well Biden is doing among Boomers; and there will be the doomscrollers playing up the fact that while third-party candidates seemed to hurt Trump more than Biden in February, that wasn't the case in March.
And some will choose to focus on one version of the question over another to fit a "candidate support stuck; electorate's mind is made up" storyline.
Maybe the difference is where we are in the electoral calendar – that it's now undeniable who the candidates will be (edit: the Pennsylvania primary is in 2 weeks). But I think we'd all be wise to treat this poll as an outlier, for a handful of methodological reasons.
- Margin of Error: The sample size was smaller, so the MoE was bigger. The sample for this survey contained "870 registered Pennsylvania voters, including 390 Democrats, 356 Republicans, and 124 Independents". As a quick note, Pennsylvania is a closed primary state, meaning Independents can not vote in primaries. In February, they polled "1,006 registered Pennsylvania voters, including 450 Democrats, 414 Republicans, and 142 Independents."
They say, "The sample error for this survey is +/- 4.0 percentage points when the design effects from weighting are considered. The sample error for questions based on subgroups is larger. The sample error for the two-way presidential horse race question (n=431) is +/- 5.7% and the sample error for the multi-candidate presidential horse race question (n=430) is +/- 5.7%."
Nevertheless, most media outlets, Newsweek included, report it as a +/-4% margin of error. This is the margin of error for the overall survey, meaning questions that all 870 people answered. It is not the margin of error on either of these presidential contest questions. - Weighting: Don't blame the sample, necessarily. They recruited using Aristotle to obtain a list of registered voters; they recruited via mail and gave respondents the option to complete the survey by phone or online (they do not say how many chose one method or the other, they do not say how many invitations they sent). They do acknowledge weighting the sample to known characteristics of Pennsylvania voters. They say, "Survey results were weighted (age, gender, education, geography, vote history, and party registration) using an iterative weighting algorithm to reflect the known distribution of those characteristics." I'll explain more about that in the section after this, but just know that it's both one of the simplest methods of weighting, and one of the most frequently used, including by very reputable pollsters, including Pew Research.
However, we don't know what kind of weighting was involved in the randomized sampling of a split-ballot experiment. We know they used raking (see below) to weight their sample to known characteristics of registered voters in the state; we know the sample was randomly assigned each experiment; we can surmise those sub-samples were also then weighted so they would look like each other, and (I assume) look like the electorate. - Split-Ballot Experiments: In this poll, they designed a split-ballot experiment to ask about presidential preferences. About half of the sample got one form of the question (e.g., the head-to-head) and the other half got the other form of the question (e.g., a four-way race). In each form, respondents could also choose "someone else" or "don't know". The makeup of each sub-sample is meant to be identical based on party registration and voter characteristics (e.g., gender, race, ethnicity, income, education, etc.).
The argument in favor of the split test is that exposure to one version of the ballot won't influence your answers to the second version. But there's also something to be said for simply randomizing the sample so some see a head-to-head matchup first, and others see the multi-candidate ballot first, and vice versa.
Why might you choose this method instead? One advantage is you'd be able to see how an individual respondent's preferences change when they have only two options (really 4 when you count "Someone else" and "don't know") or when they have four options; that is, we can't really say that preferences "shift" from one candidate to another with a really high rate of confidence – each sample is undergoing a completely different treatment.
There's another scenario to run, especially in the head-to-head, which is to give people only three options: candidate A, candidate B, won't vote. Could be interesting too.
We also have to wonder about question order
The question order of any survey can influence the outcomes. The way Franklin & Marshall appear to organize their surveys is to ask about how people feel about the direction the state is headed in, and their feelings about their own finances. Then they ask a battery of questions about state policy issues. Then they ask about party registration, likelihood to vote, interest in the elections, favorability of the two main presidential candidates and the two main senatorial candidates, job approval for Governor Shapiro, job approval of Senator Casey, job approval of President Biden, and then they are shown one of the split-ballot experiment treatments. After that, they ask about which candidate is best described by various statements about their ability to handle the economy or the military, their character and judgment, honesty and trustworthiness, their empathy for Americans, their position on abortion and same-sex marriage, and their age.[1]
There's an obvious reason to do it this way. A pollster might be concerned that by asking people to establish their candidate preference first, or their party/political identity first, this might influence their subsequent responses because they will be primed to conform to the typical policy preferences of those alignments and identities. If I tell you I support Trump first, for example, I might be more inclined to take an anti-immigration stance later than I would if you never asked me about Trump at all.
Perhaps the risk of this order effect is greater than the risk of a different order effect, which is to ask people about their policy preferences first, and then ask them about their candidate selections. But it's also a kind of artificial treatment – we do seem to have some evidence that people's policy preferences and their party identification are not as closely correlated as we might presume. People continue to marvel at how many conservatives do not in fact want abortion bans, for example. Are we, inadvertently, softening people's attitudes towards Biden by asking them about marijuana and voting laws? When they go to the polls will they be more persuaded by policy or pop culture? I don't know the answer, but I do wonder.
So what state issues did they ask about? Well, in February, they asked about whether to ban, regulate or tax "skill games" (think, video poker in bars); legalizing recreational marijuana; charging electric vehicle owner's a $290 annual fee to fund roads and bridges. In March, they asked about recreational marijuana again but added a question about where legal marijuana should be sold; changes to the state's voting laws.
It's looking like favoring marijuana legalization is a pretty non-partisan position these days. But voting regulations have been of late politicized and polarized. It's hard to say what exposure to questions about various elements of these debates might have on your attitudes towards one candidate or another without running the same questions in a different order. Someone give me money to do this experiment, just to sate my curiosity!!
[1] While 40% of respondents in the April survey said Biden was too old to serve another term, another 40% of respondents said that both candidates are too old. Here's my wild guess: Republicans and some Independents are more likely to point the age finger at Biden, and Democrats are more likely to say, "yeah, look, they both are." Which means, to some degree, the answers to this question are forms of expressive responding, which I'm hoping to dig in on more soon with an expert for the show.
Weighting
There are lots of ways to approach weighting samples.
But why do we do it? No matter what methods we use to recruit respondents into a survey sample, we will not automatically find ourselves with a representative sample. Pollsters use three main methods to get to a representative sample of registered voters:
- Probability sampling: this means that everyone has the same likelihood of being contacted to take the survey. This is most frequently done through either sending a postcard or letter to a random sample of US addresses, or, less frequently now, through random digit dialing US telephone numbers.
- Screening and quotas: we can set quotas of a minimum number of participants with a certain characteristic (age, or race, for example). We can exclude or include people based on how well they 'fit' our understanding of the population we're trying to represent.
- Weighting: once we have the responses we have, we can take known characteristics about the population and weight the sample we have so that the values of each of their response are counted in proportion to that participant's natural occurrence in the population.
The survey we talked about above describes its weighting process as using an "iterative weighting algorithm". It's also called raking, and here's how Pew Research describes it:
Raking
For public opinion surveys, the most prevalent method for weighting is iterative proportional fitting, more commonly referred to as raking. With raking, a researcher chooses a set of variables where the population distribution is known, and the procedure iteratively adjusts the weight for each case until the sample distribution aligns with the population for those variables. For example, a researcher might specify that the sample should be 48% male and 52% female, and 40% with a high school education or less, 31% who have completed some college, and 29% college graduates. The process will adjust the weights so that gender ratio for the weighted survey sample matches the desired population distribution. Next, the weights are adjusted so that the education groups are in the correct proportion. If the adjustment for education pushes the sex distribution out of alignment, then the weights are adjusted again so that men and women are represented in the desired proportion. The process is repeated until the weighted distribution of all of the weighting variables matches their specified targets.
Raking is popular because it is relatively simple to implement, and it only requires knowing the marginal proportions for each variable used in weighting. That is, it is possible to weight on sex, age, education, race and geographic region separately without having to first know the population proportion for every combination of characteristics (e.g., the share that are male, 18- to 34-year-old, white college graduates living in the Midwest). Raking is the standard weighting method used by Pew Research Center and many other public pollsters.
